


Server & Database
Monitor
Real-time visibility into your Odoo server and PostgreSQL database. Monitor CPU, memory, disk, live logs, long-running queries, lock waits, and scheduled actions — all in one dashboard.
● Odoo 19
📈 Live Dashboard
📄 Log Viewer
🕘 Cron Monitor
🔒 Lock Analysis
⚠ Smart Alerts
One-Time License
$49.99
per Odoo instance · perpetual license
- Full source code included
- Odoo 19 Community & Enterprise
- No monthly fees
- 6 months free updates
- Email support included
Questions? contact@velriostack.com
What's Included
Everything Your Team Needs to
Everything Your Team Needs to
Monitor Odoo
Eight powerful monitoring features in a single Odoo backend app.
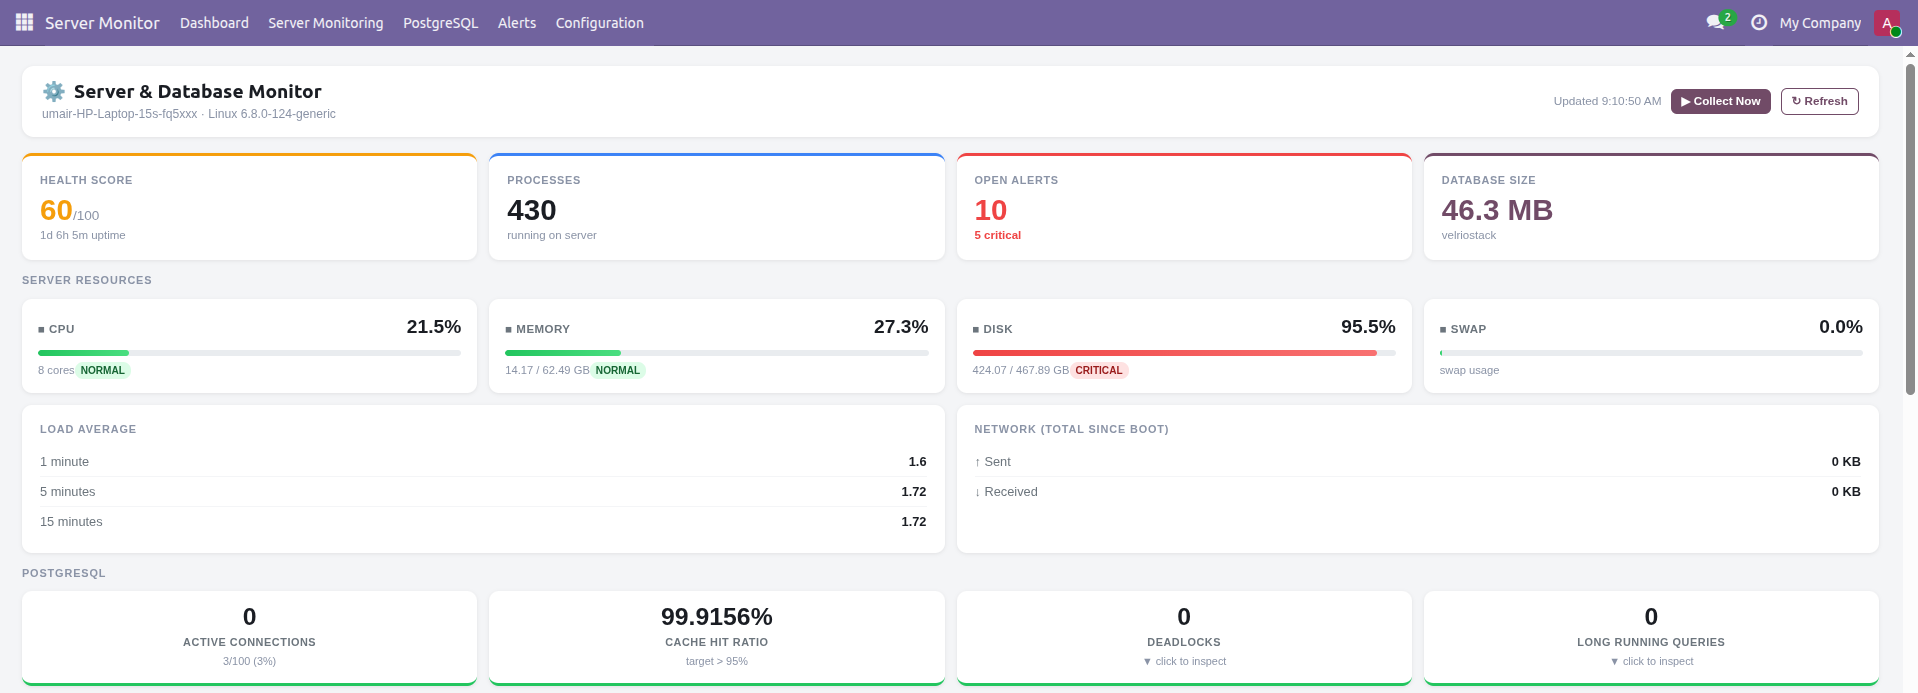
Real-Time Dashboard
- Overall health score (0–100)
- CPU, Memory, Disk, Swap progress bars
- Load average & network traffic
- Auto-refresh every 30 seconds
PostgreSQL Monitoring
- Active / idle / waiting connections
- Cache hit ratio with threshold alerts
- Deadlock counter & lock wait inspector
- Long-running query table with full SQL
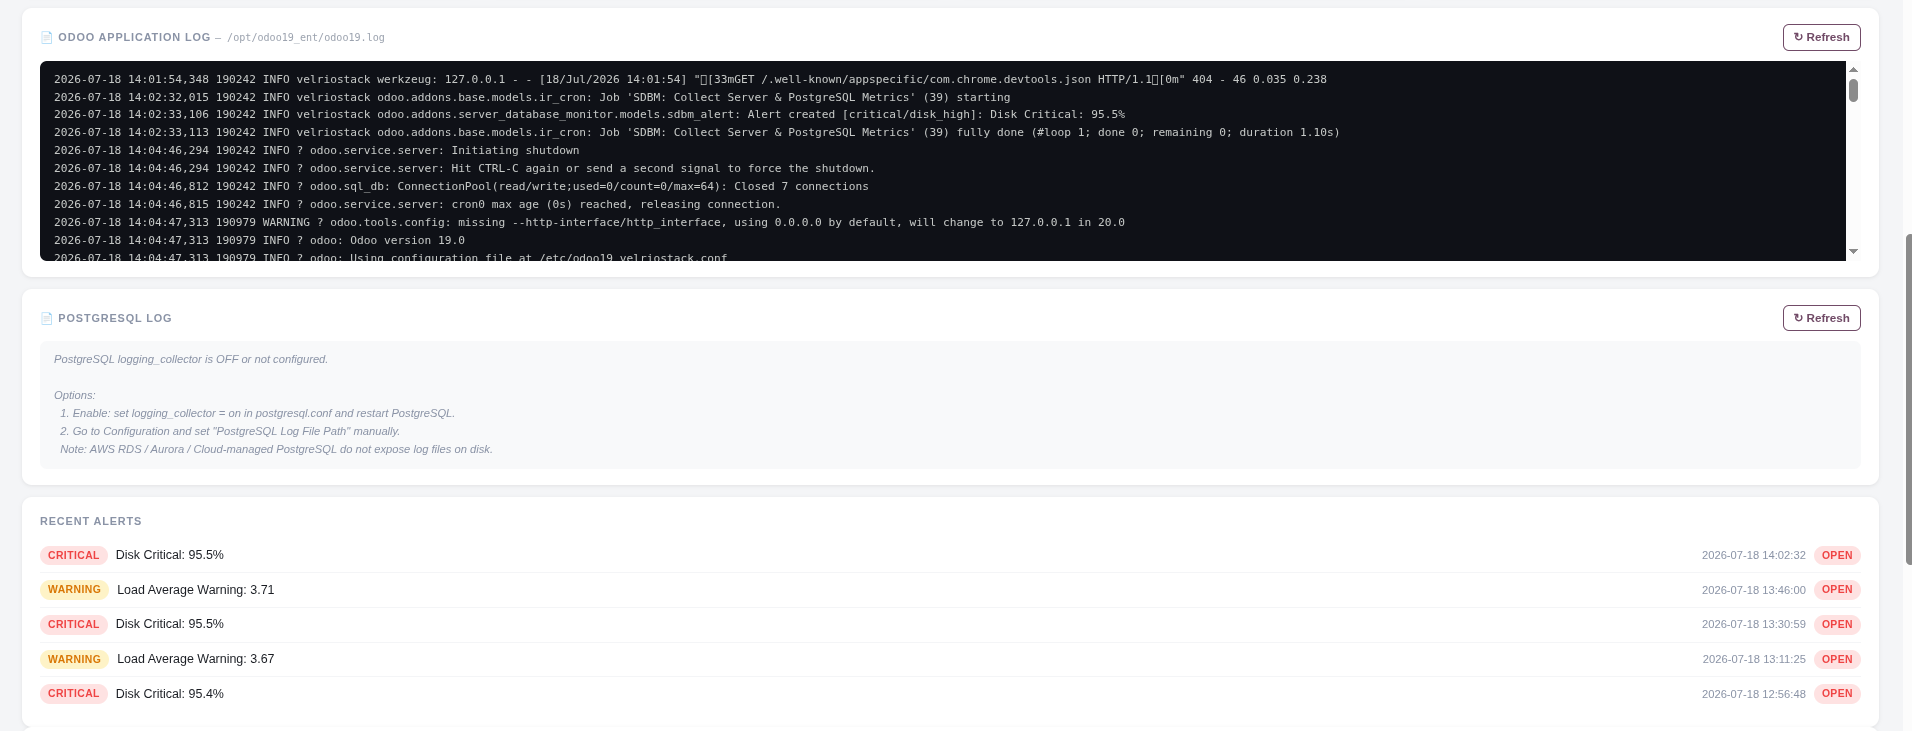
Odoo Log Viewer
- Live Odoo application log (last 80 lines)
- Auto-detects path from Odoo config file
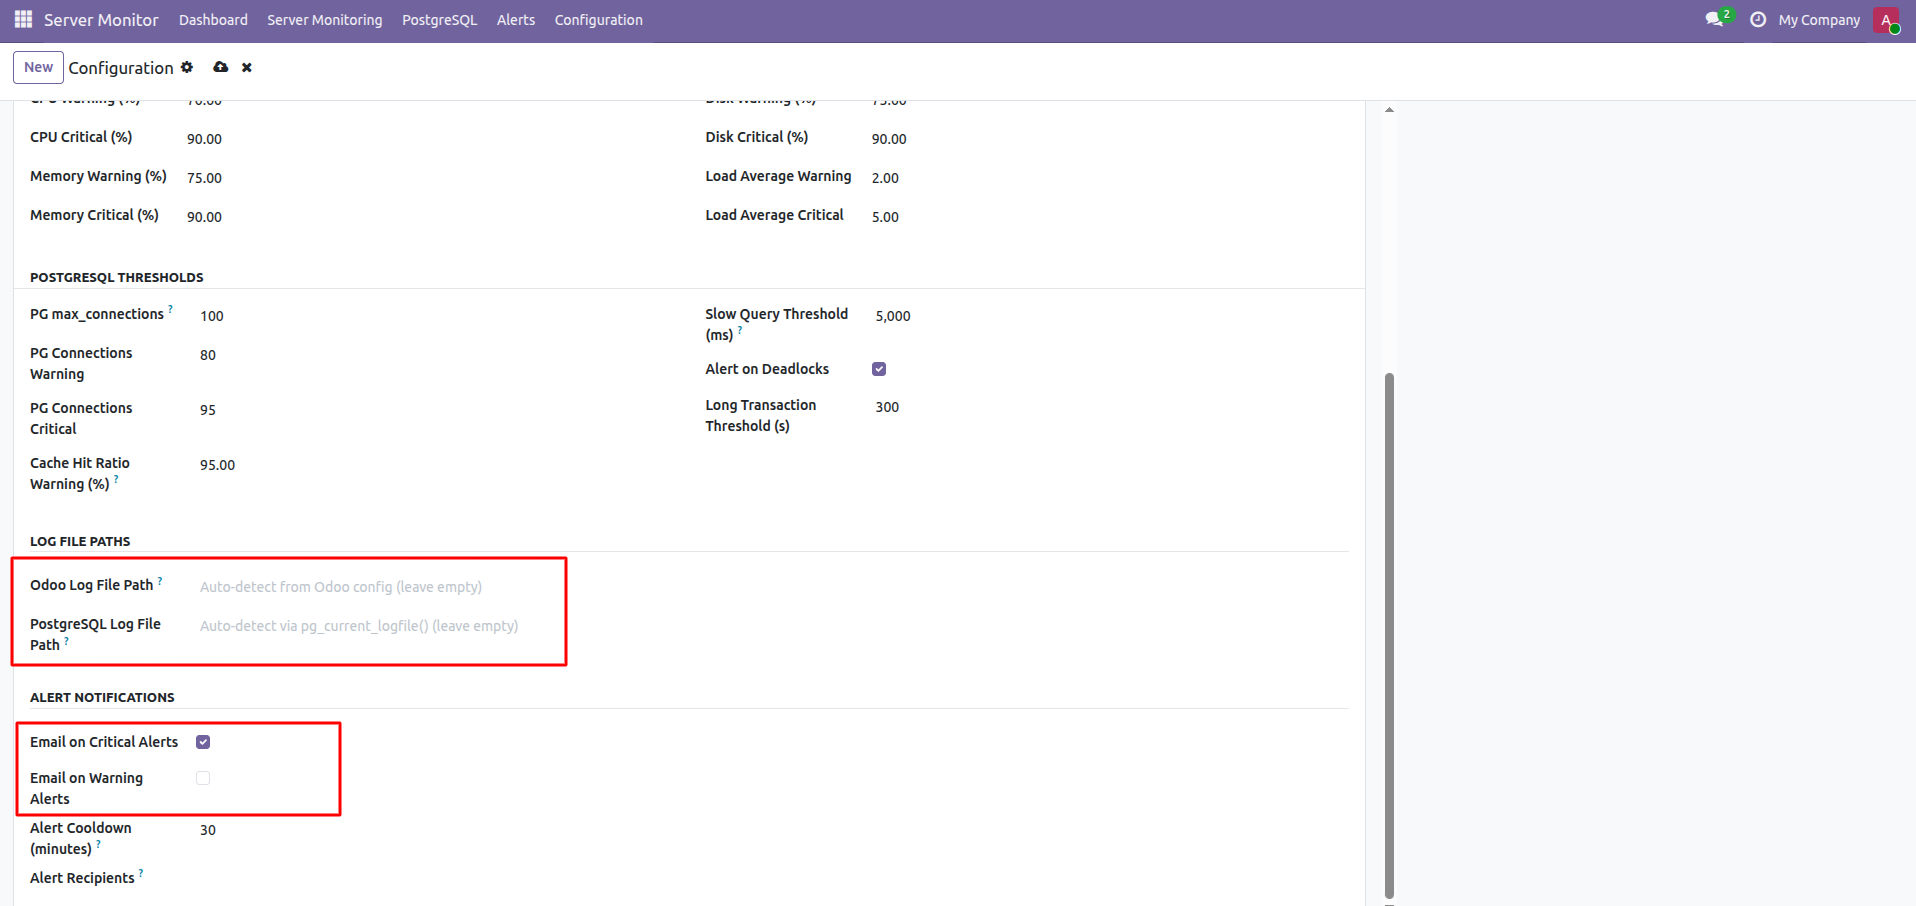
- Manual path override in Configuration
- Works with Docker, bare-metal, cloud setups
PostgreSQL Log Viewer
- Live PostgreSQL server log (last 80 lines)
- Auto-detects via pg_current_logfile()
- Manual path override in Configuration
- Supports AWS RDS / cloud managed setups
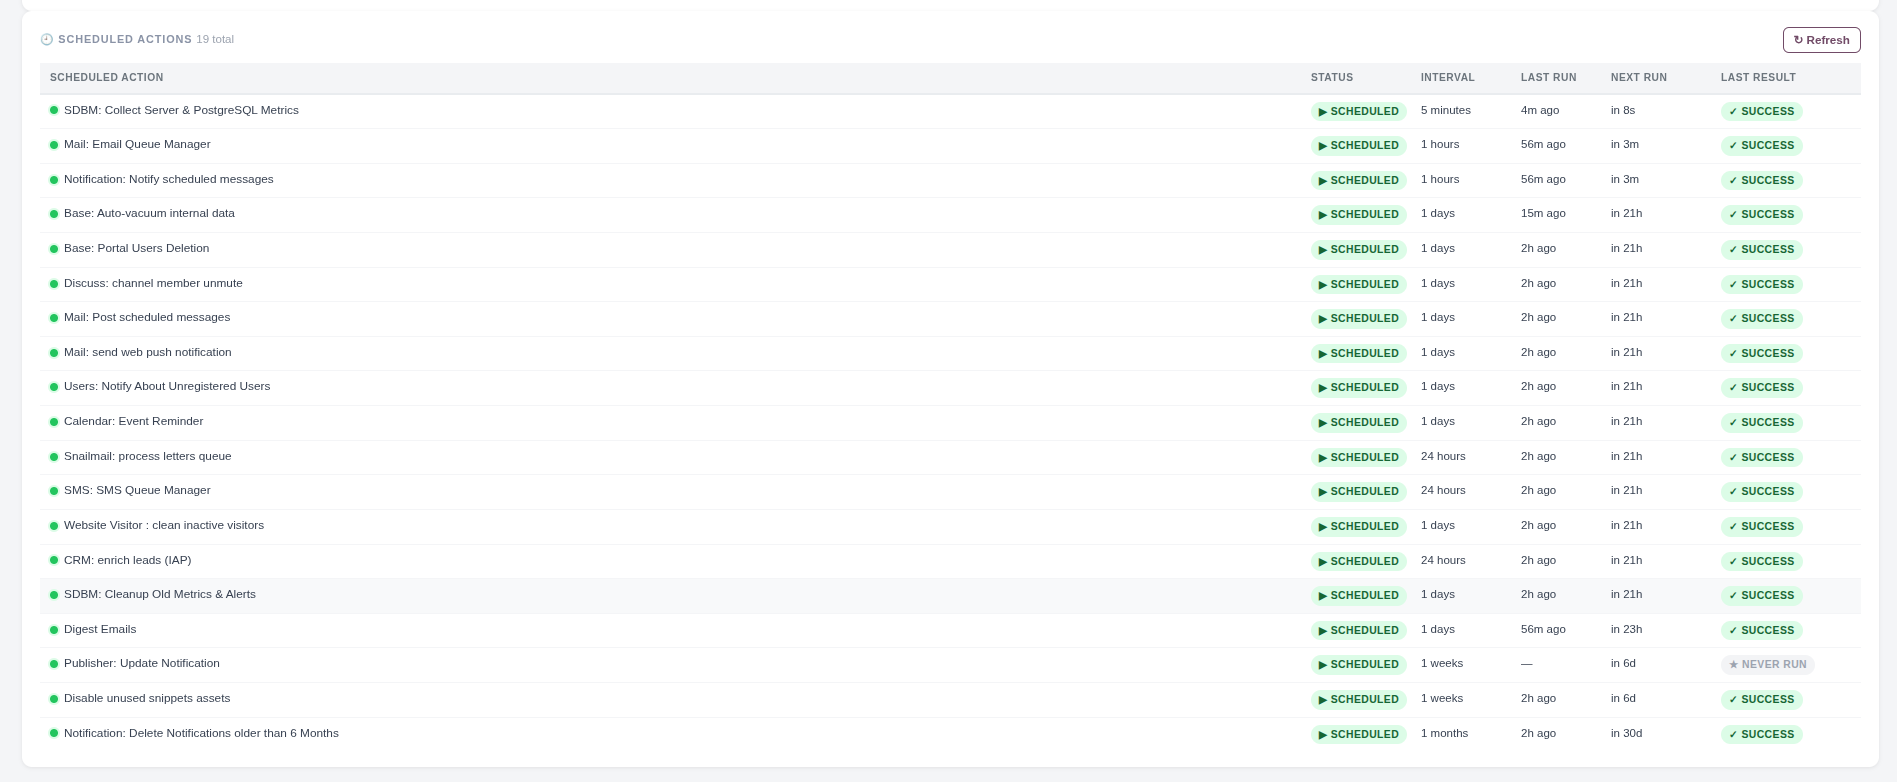
Scheduled Action Monitor
- All crons: status, interval, last & next run
- Success / Error / Skipped detection
- Error details from ir.logging (48h window)
- Overdue detection with visual highlight
Lock & Query Inspector
- Click Deadlocks → see blocked PIDs instantly
- Blocking vs blocked query side-by-side
- Click Long Running Queries → full query text
- Duration, user, app, wait event per query
Email Alert Notifications
- Configure recipient email in Settings
- Triggered when thresholds are breached
- Cooldown period prevents alert flooding
- Critical / Warning severity email templates
Smart Alert Engine
- Configurable thresholds per metric
- Critical / Warning / Info severity levels
- Alert history with acknowledge & resolve
- Recent alerts panel on the dashboard
Screenshots
See It in Action
Real screenshots from a live Odoo 19 instance — built inside Odoo, no external tools.
Requirements
Technical Details
Odoo Version
Odoo 19 (Community & Enterprise)
Python Library
psutil (pip install psutil)
PostgreSQL
PostgreSQL 14+ (all editions)
License
OPL-1 · Perpetual
Get Started
Ready to Monitor Your Odoo Server?
Purchase the license or request a live demo — we'll set it up for you.
Leave your details and we'll get back to you to complete your purchase or schedule a demo.
Buy Server & Database Monitor
Share your details and we'll follow up to complete your purchase.